In the past, we have helped government organizations, charities, other non-profit organizations, even private organizations to bring more transparency to their accounts or to make better sense of their financial data. This time we have a new kind of customer and we are totally excited about it.
Swaraj Abhiyan - a political organization, from India.
“Swaraj Abhiyan is a political organization in India that began on 14 April 2015. It arose from a meeting of supporters of Yogendra Yadav, Prashant Bhushan, Prof. Anand Kumar and Ajit Jha, in Gurgaon. The organization claims to want to transform ideology into reality and to achieve swaraj in all aspects of life - political, economical, social and cultural”
- Wikipedia.This not the first time a political organization is making attempts to become transparent. Aam Aadmy Party of India had published all their Donation details online in the past. But this is the first time a Political organization is publishing their Contributions as well as Expenditures, in detail, online. And that is what is making it really exciting.
Swaraj Abhiyan had published their financial statements online in PDF form, at the accounts section in their website. This was a scanned copy of a document they had submitted to authorities. The document served the purpose of information disclosure well but it was still very difficult to process the information in it, for a supporter visiting the site. We helped them publish the same data, but in detail, as an interactive report.
This report, accessible from Swaraj Abhiyan web site, will show them a summary of the contributions received and the expenditures incurred. A site visitor can then drill down the Contributions and Expenses to sub categories, all the way down to an individual receipt, bill or cheque issued. They can get the overall picture at the first screen and go deeper to see individual transactions. This gave the visitors the complete picture, summary and detail at one place. Visitors can also search for terms (such as “events”, “print”, vendor names) and even download the data for local use or share their findings on social networks. Searching for "Prashant Bhushan"
We look at this as a very positive trend in politics and we hope this will set the bar high for Political organizations in matters of transparency and openness. No need to mention how much trust and confidence it can bring to voters, recent events in India has spoke for the importance of transparency in a democracy.
If you are a supporter, citizen or donor, share this story with your organization and ask them to adopt transparency. And yes,
please spread the word, an informed world is a better world!
When the Office of Management and Budget (OMB) released President's Budget for Fiscal Year 2016 in machine readable form, couple of weeks back, it was first of its kind that we had seen. We have seen private organizations and non-profits disclosing their financial information before (
Buffer,
Baremetrics etc…). The
UsaSpending.gov was another example we came across, for which we published reports showing the data available there, which we removed later due to concerns related to the quality of data available. So this time we were very excited to see OMB putting all that information in to public, encouraging further analysis and discussion. Definitely a big step in promoting transparency in governance.
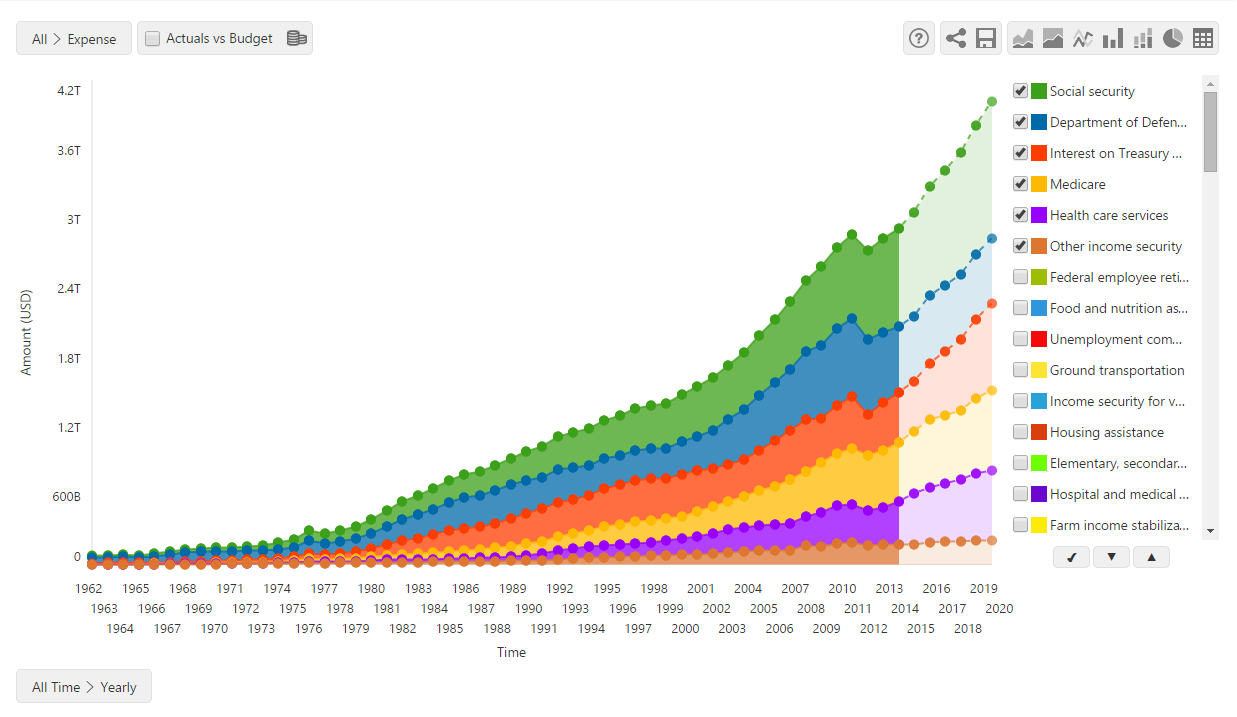
The data published by OMB is at account level detail. Here at OpenReporting, our tool can visualize data from a top level summary - like income, expense - and drill down all the way down to data at transaction level. So we hesitated a bit at first on whether or not to publish this on our portal but after seeing the excitement in the transparency community, we decided to go ahead and publish the reports at account level detail. You can find the resulting report here.
The data consists of actual revenues and spending (we call them income and expense in our reports) from financial year 1962 to 2014 and budget amounts for 2015 to 2020. In coming years, we will be able to show comparison of actual against budget as data is made available. If you are aware of any machine readable dataset for past budget amounts, please let us know and we will upload it here so that you can compare them with actuals for past years.
The amounts shown in the report are in nominal dollars and hence the change in budget over year may appear dramatic at first sight. It may be a good idea to keep the inflation rate in mind when analyzing the report. We had thought about publishing the data in current day dollars but later dropped this plan to keep consistency with the published data.
The main source of the data are the files available in White House’s GitHub repository. We have also used the various excel reports published, to cross check the figures in report. The interpretation of the data was done with the help of user guides below. You may want check them if you have any questions.
When it comes to transparency, our focus is to provide the most simplest and complete visualization for the citizens so that they can easily get a picture of how their government is spending resources. Please do let us know your thoughts on how we can improve this further and help us spread the word on social media.